Hello.
It depends. Jmix BPM addon uses Flowable process engine, which is using BPMN2.0 specification https://www.bpmn.org/ same organization that defines UML too https://www.omg.org/
BPMN2 is used by the engine root project jBPM/RH PAM, and forks like Activiti, Flowable, Camunda etc. Lot of other process engines use BPMN2 too.
So now the question is, what kind of model does your 3rd party service export?
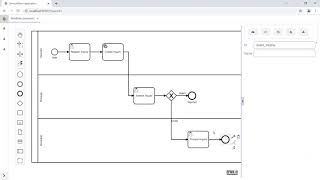
Try to see if you can save the export into an XML file, then go to BPM process modeler and try to load it. If it loads, it’s good, and you can extend the BPM process modeler and add a button to import your models.
If it does not, then either your model is in a different standard/format, or there are details in the XML that BPM does not like. A lot of these tools will have something specific to their implementation in the model file, and most will report an error if they find something they don’t recognize, but these errors are usually non-blocking errors and standard elements should be recognized and displayed.
If it’s a different standard, then you may try to find a model-to-model transformation tool, and possibly convert it, or do it yourself, but, you will be in a world of pain.
Another solution that comes to mind is if you can get a picture of the process model, rather than the model itself. BPM has the option to display a picture of its process, so maybe your 3rd party system can do the same, and then if you can get a picture from your 3rd party service, you can put it in your filesystem and make a screen to display it - it may be easier to handle if it’s only for display.