Chart add on using multiple datacontainers

Hi,

I have these two datacontainers:

<keyValueCollection id="sentInvoicesDc" >
            <loader id="sentInvoicesDl">
                <query>
                    <![CDATA[
                SELECT e.currencyCode, SUM(e.totalIncludeTax) AS total_sum
                FROM TrxHeadSummary e
                WHERE e.direction = 'Sent'
                AND e.trxDate >= :tenDays
                AND e.co = :co
                GROUP BY e.currencyCode
                HAVING SUM(e.totalIncludeTax) > 0
            ]]>
                </query>
            </loader>
            <properties>
                <property name="currencyCode" datatype="string"/>
                <property name="total_sum" datatype="double"/>
            </properties>
        </keyValueCollection>
        <keyValueCollection id="receivedInvoicesDc" >
            <loader id="receivedInvoicesDl">
                <query>
                    <![CDATA[
                SELECT e.currencyCode, SUM(e.totalIncludeTax) AS total_sum
                FROM TrxHeadSummary e
                WHERE e.direction = 'Received'
                AND e.trxDate >= :tenDays
                AND e.co = :co
                GROUP BY e.currencyCode
                HAVING SUM(e.totalIncludeTax) > 0
            ]]>
                </query>
            </loader>
            <properties>
                <property name="currencyCode" datatype="string"/>
                <property name="total_sum" datatype="double"/>
            </properties>
        </keyValueCollection>

I want to make a line chart, where there are two lines in different colour, where each line refers to the data in different datacontainer. Is this possible?

Best regards,
Amirul Mukminin
Hi!

The chart component supports only one data source, set via the dataSet property.
See documentation: Chart Component :: Jmix Documentation

If you are using a KeyValueCollectionContainer, you can construct your query in such a way that the data is loaded into a single container.

You can choose data from the data container to display in each chart. The encode element is used for this. An example of its use can be seen in our online demo application: UI Samples :: Candlestick Series

Best regards,
Dmitriy

Hi @d.kremnev
Thank you for the reply

I managed to do it by combining the query into a single container just as you suggested. I just have 1 more question.

<charts:chart id="chart" width="100%" height="100%" minHeight="20em">
                            <charts:tooltip trigger="AXIS">
                                <charts:axisPointer type="CROSS"/>
                            </charts:tooltip>
                            <charts:legend/>

                            <charts:xAxes>
                                <charts:xAxis/>
                            </charts:xAxes>
                            <charts:yAxes>
                                <charts:yAxis name="Total" position="LEFT" alignTicks="true">
                                    <charts:axisLine show="true"/>
                                </charts:yAxis>
                            </charts:yAxes>

                            <charts:dataSet>
                                <charts:source dataContainer="invoicesDc"
                                               categoryField="currencyCode" valueFields="sent_total_sum received_total_sum"/>
                            </charts:dataSet>

                            <charts:series>
                                <charts:bar name="Sent" yAxisIndex="0" barGap="0" >
                                    <charts:itemStyle color="#5470C6"/>
                                </charts:bar>
                                <charts:bar name="Received" yAxisIndex="0" >
                                    <charts:itemStyle color="#91CC75"/>
                                </charts:bar>
                            </charts:series>
                        </charts:chart>

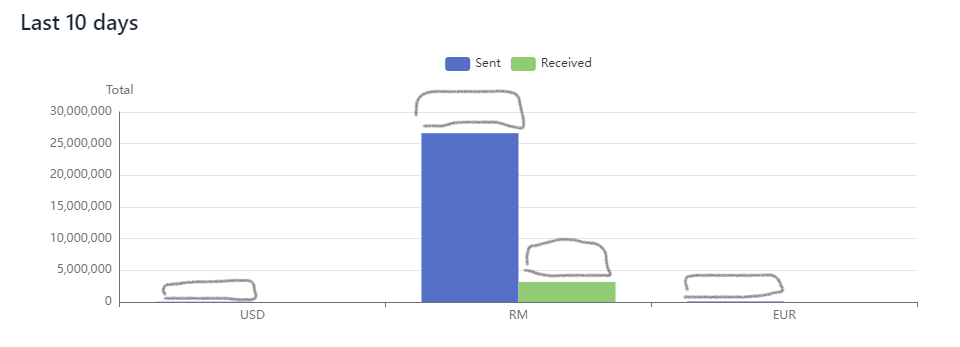
This is the xml code for the chart. I want to know if it is possible to show the value of the y-axis on top of respective bar, something like this:
Screenshot 2024-08-14 101225
Thank you,
Best regards,
Amirul Mukminin

Edit:
When I log in, the chart displays correctly. But if I click the app title to go to the dashboard, the chart does not show anything. The IDE log does not show anything, but I noticed this in the running app and browser console:
image

Is there any reason for this behaviour?

Hi!

For point 1

I want to know if it is possible to show the value of the y-axis on top of respective bar…

You can define a tooltip as follows:

<charts:tooltip trigger="ITEM" position="TOP"/>

Result:
image

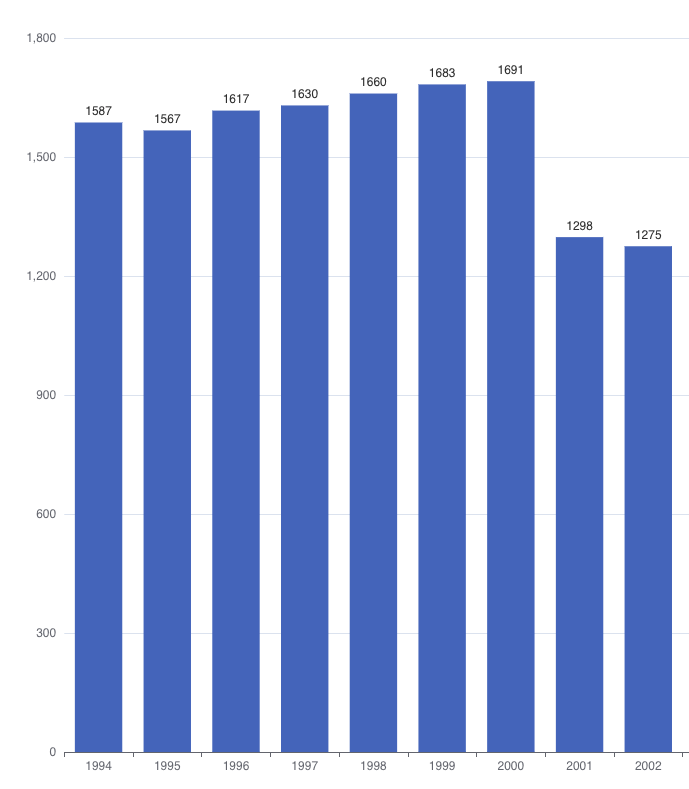
If you want the values ​​to always be displayed, use the label attribute in the series bar:

            <charts:series>
                <charts:bar>
                    <charts:label show="true"
                                  position="TOP"/>
                </charts:bar>
            </charts:series>

Result:
image

For point 2

It looks like the error is due to incorrect data configuration and encode.
You can increase the logging level of the dataset serialization class to see what data is being sent to the client. To do this add following to your application.properties:

logging.level.io.jmix.chartsflowui.kit.component.serialization.JmixChartSerializer = debug

You can see the supplied data and try to reproduce the problem on the original eCharts example. There you can also modify the data so that the display is correct, then transfer the changes to your project.

Best regards,
Dmitriy

Hi @d.kremnev

Thank you for the reply.

I tried using the eChart example using the log after implementing the logging you suggested. I have further questions. I load the data for the chart is using keyValueCollection. The query I use is

 <keyValueCollection id="invoicesDc">
            <loader id="invoicesDl">
                <query>
                    <![CDATA[
            SELECT
                e.currencyCode,
                SUM(CASE WHEN e.direction = 'Sent' THEN e.totalIncludeTax ELSE 0 END) AS sent_total_sum,
                SUM(CASE WHEN e.direction = 'Received' THEN e.totalIncludeTax ELSE 0 END) AS received_total_sum
            FROM TrxHeadSummary e
            WHERE e.trxDate >= :tenDays
            AND e.co = :co
            GROUP BY e.currencyCode
            HAVING SUM(CASE WHEN e.direction = 'Sent' THEN e.totalIncludeTax ELSE 0 END) > 0
            OR SUM(CASE WHEN e.direction = 'Received' THEN e.totalIncludeTax ELSE 0 END) > 0
            ]]>
                </query>
            </loader>
            <properties>
                <property name="currencyCode" datatype="string"/>
                <property name="sent_total_sum" datatype="double"/>
                <property name="received_total_sum" datatype="double"/>
            </properties>
        </keyValueCollection>

The log that I get is

2024-08-14T14:27:56.981+08:00 DEBUG 10648 --- [io-8080-exec-10] i.j.c.k.c.s.JmixChartSerializer          : Starting serialize DataSet
2024-08-14T14:27:56.982+08:00 DEBUG 10648 --- [io-8080-exec-10] i.j.c.k.c.s.JmixChartSerializer          : Serialized DataSet: {"source":[{"currencyCode":"USD","sent_total_sum":62100,"received_total_sum":0,"$k":"7"},{"currencyCode":"RM","sent_total_sum":26890890.29,"received_total_sum":3176317.86,"$k":"8"},{"currencyCode":"EUR","sent_total_sum":104819.53,"received_total_sum":0,"$k":"9"}]}
2024-08-14T14:27:56.983+08:00 DEBUG 10648 --- [io-8080-exec-10] i.j.c.k.c.s.JmixChartSerializer          : Starting serialize ChartOptions
2024-08-14T14:27:56.983+08:00 DEBUG 10648 --- [io-8080-exec-10] i.j.c.k.c.s.JmixChartSerializer          : Serialized ChartOptions: {"legend":{"type":"plain"},"tooltip":{"trigger":"item","axisPointer":{"type":"line"}},"series":[{"type":"bar","name":"Sent","label":{"show":true,"position":"top"},"itemStyle":{"color":"#5470C6"},"barGap":"0","yAxisIndex":0},{"type":"bar","name":"Received","label":{"show":true,"position":"top"},"itemStyle":{"color":"#91CC75"},"yAxisIndex":0}],"xAxis":[{"type":"category"}],"yAxis":[{"type":"value","axisLine":{"show":true},"alignTicks":true,"position":"left","name":"Total"}]}

the modified code that I used and works in eChart is:

option = {
  xAxis: {
    type: 'category',
    data: ['USD', 'RM', 'EUR']  // Currencies
  },
  yAxis: {
    type: 'value'
  },
  series: [
    {
      name: 'Sent',
      data: [62100, 26890890.29, 104819.53],  // Sent totals
      type: 'bar',
      itemStyle: {
        color: '#5470C6'  // Custom color for "Sent"
      },
      label: {
        show: true,
        position: 'top'
      }
    },
    {
      name: 'Received',
      data: [0, 3176317.86, 0],  // Received totals
      type: 'bar',
      itemStyle: {
        color: '#91CC75'  // Custom color for "Received"
      },
      label: {
        show: true,
        position: 'top'
      }
    }
  ]
};

but I’m confused on how to

Thank you so much for your help

Best regards,
Amirul Mukminin

Note: The chart loads correctly after login or when I typed the URL directly in the search bar.This only happens when I click the app logo on the top left, which it redirects to MainView with empty chart. Once on MainView, if I reload the page, the chart also loads correctly. Here is a sample project for your reference.

Hi!

Your code that was changed is not supported by the Jmix Framework natively. As you may have noticed, the dataset property is used to describe data through a container. Here is the documentation for it: Dataset - Concepts - Handbook - Apache ECharts

As a result, data elements are not supported for legend, axis, series, etc. This data is taken from the dataset.

To investigate the error, you can try to change your data by writing it in dataset array of classes format (find an example in the link attached above):

    source: [
      { product: 'Matcha Latte', '2015': 43.3, '2016': 85.8, '2017': 93.7 },
      { product: 'Milk Tea', '2015': 83.1, '2016': 73.4, '2017': 55.1 },
      { product: 'Cheese Cocoa', '2015': 86.4, '2016': 65.2, '2017': 82.5 },
      { product: 'Walnut Brownie', '2015': 72.4, '2016': 53.9, '2017': 39.1 }
    ]

If your data is static and will not change, then it will be convenient to use nativeJson to insert data.
Or you can describe the main part of the chart options with XML, and add the missing elements using nativeJson. These options will merge in the resulting chart.

Please see the example in the online demo application: UI Samples :: Chart Native JSON

Best regards,
Dmitriy

Hi @d.kremnev

My data is not static as it is loaded from the database and will change each time there are a new entry. I attached a sample project file with steps on how to achieve the error on the previous reply for your reference.
To put it simply:
Run the app

  1. Login
  2. Chart is loaded correctly/no error shows in browser console
  3. Click any other menu
  4. Click the app title (SampleChart) on the top left
  5. The chart is not loaded (error shows in browser console)

Thank you, best regards,
Amirul Mukminin

Hi!

Thanks for the test project. After investigation I can say that this is not a problem in your data, it is a bug in the order of creating chart elements.

I’ve created an issue to fix the problem: Chart dataset can't be created on client side after detaching · Issue #3578 · jmix-framework/jmix · GitHub
The fix will be published in the next 2.3.2 release.
Thank you for your report.

Best regards,
Dmitriy


P.S.

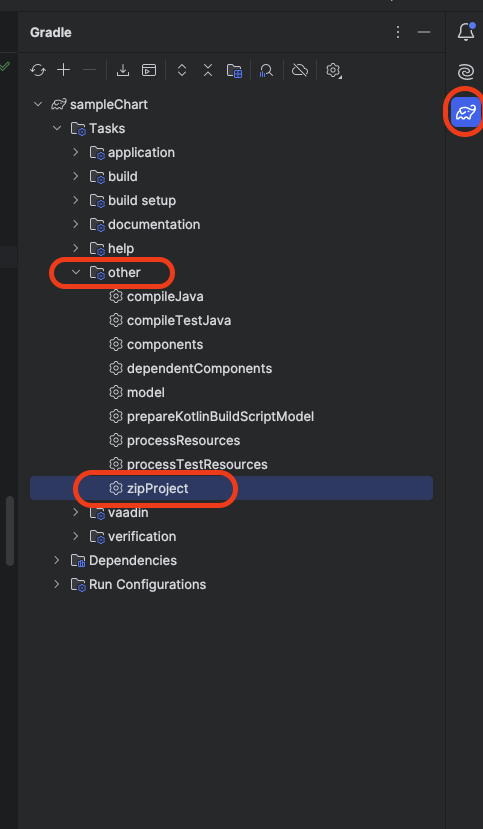
You can create a project archive for a share using the gradle command: Gradle -> zipProject:
image

The archive will appear in the root folder of the project.

When archiving in this way, you don’t need to create archives with unnecessary files yourself. The entrie project size about 300 MB, this size is due to the large number of frontend sources, which are located in the node_modules folder.
Archiving with gradle task does not pack unnecessary files. The final archive will be several KB in size.