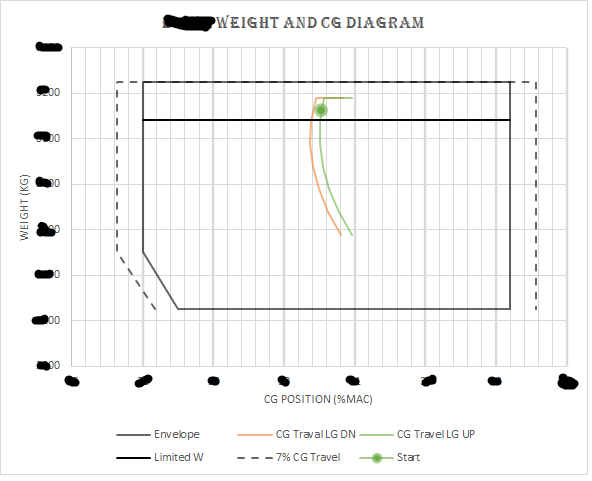
I am trying to reproduce the graph below using a chart component in Jmix:
I tried with the XYChart component and could obtain the graph below but I could not connect the points with lines.
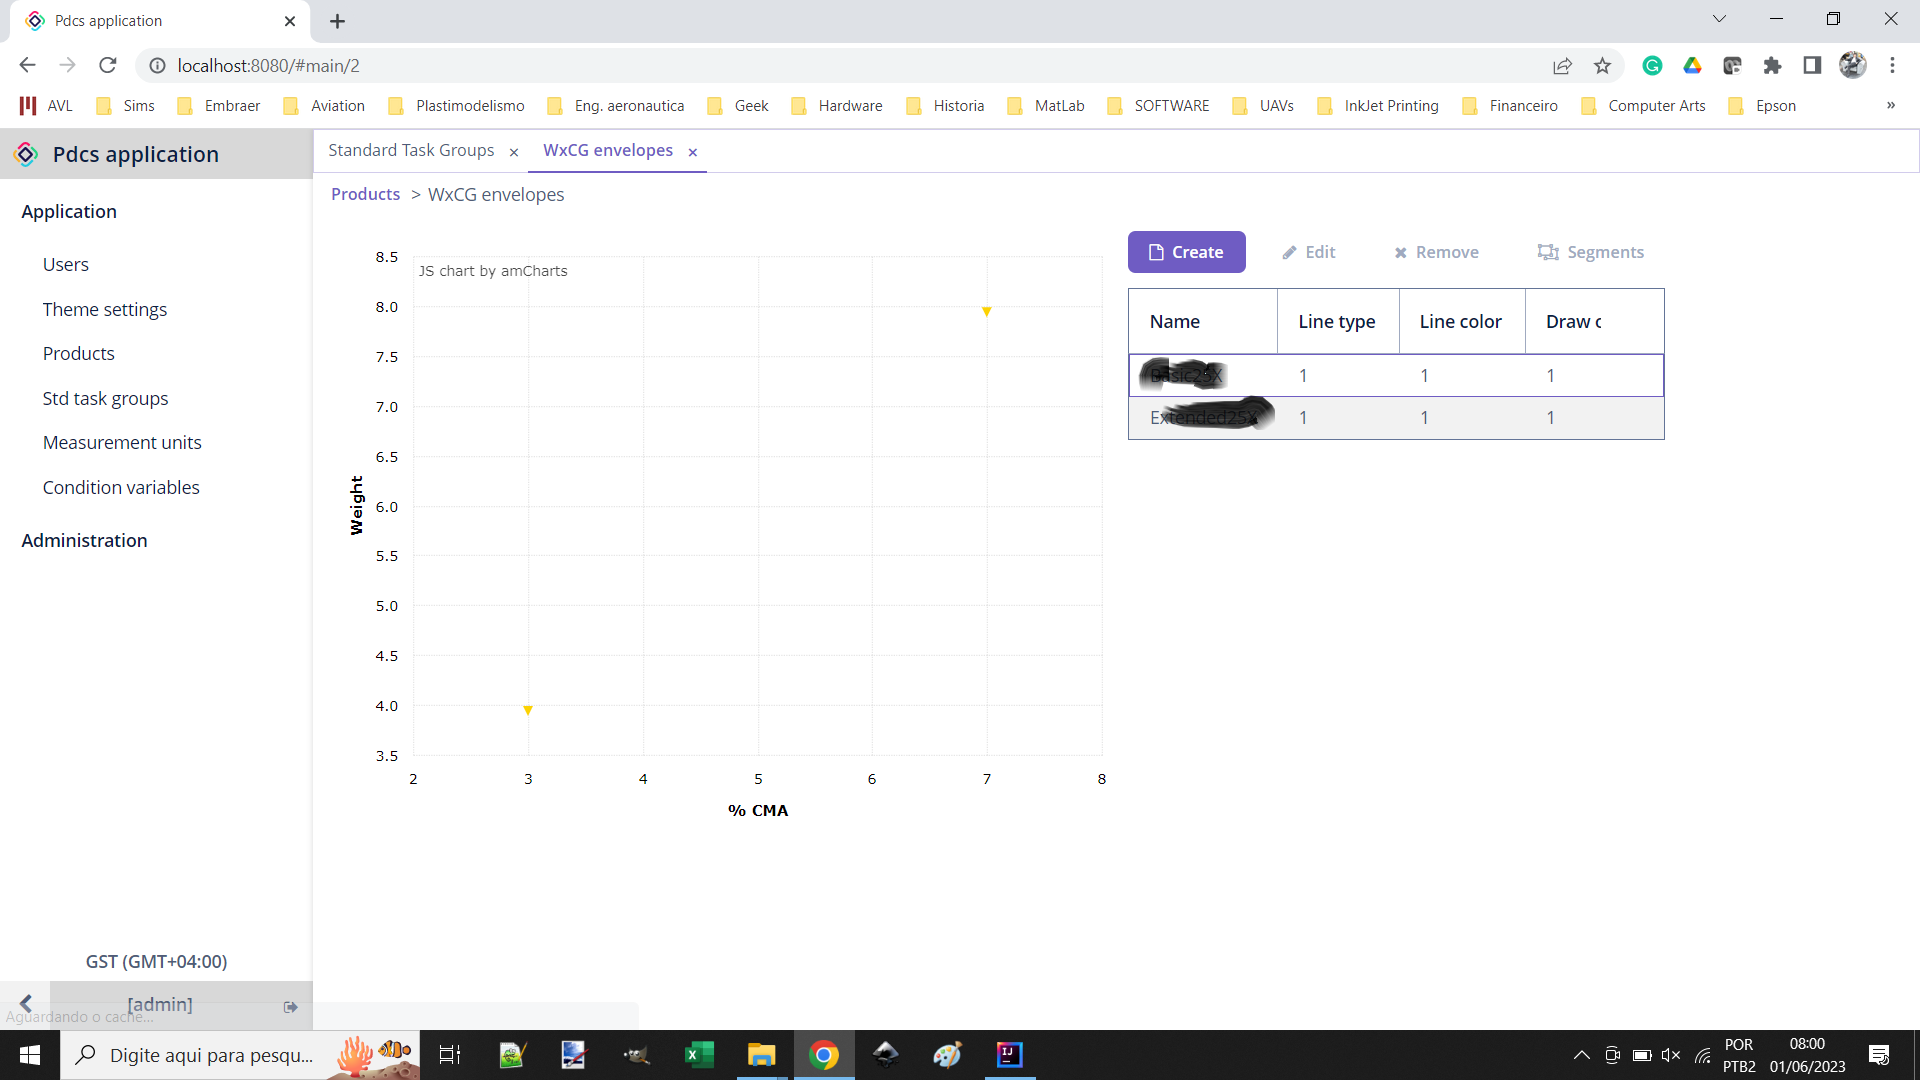
Is the XYChart adequate or should I use any other chart type? The orange and green curves maybe could be obtained through a SerialChart but the black envelope probably not.
It must be possible to create graph “series” programmatically because the lines are to be created by points given by the user.
I already tried with LineChart and SerialChart but these do not allow having different points at the same X value.
Any hints on how to proceed?
Thanks.
Ramiro.