
Hello!
Could you clarify what Jmix version do you use?
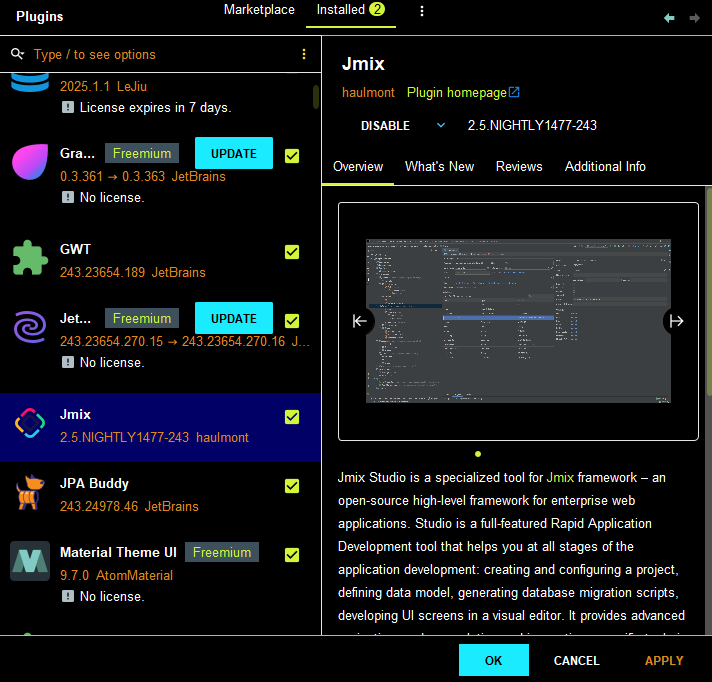
2.5.NIGHTLY1477-243
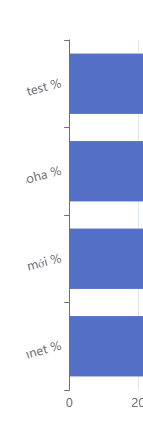
You need to shift the graph itself relative to the component boundaries, for instance:
<charts:grid>
    <charts:gridItem left="10%" right="10%"/>
</charts:grid>
See Documentation - Apache ECharts :: grid.left for more details.