I collect cost and budget data from different sources and save them in my application.
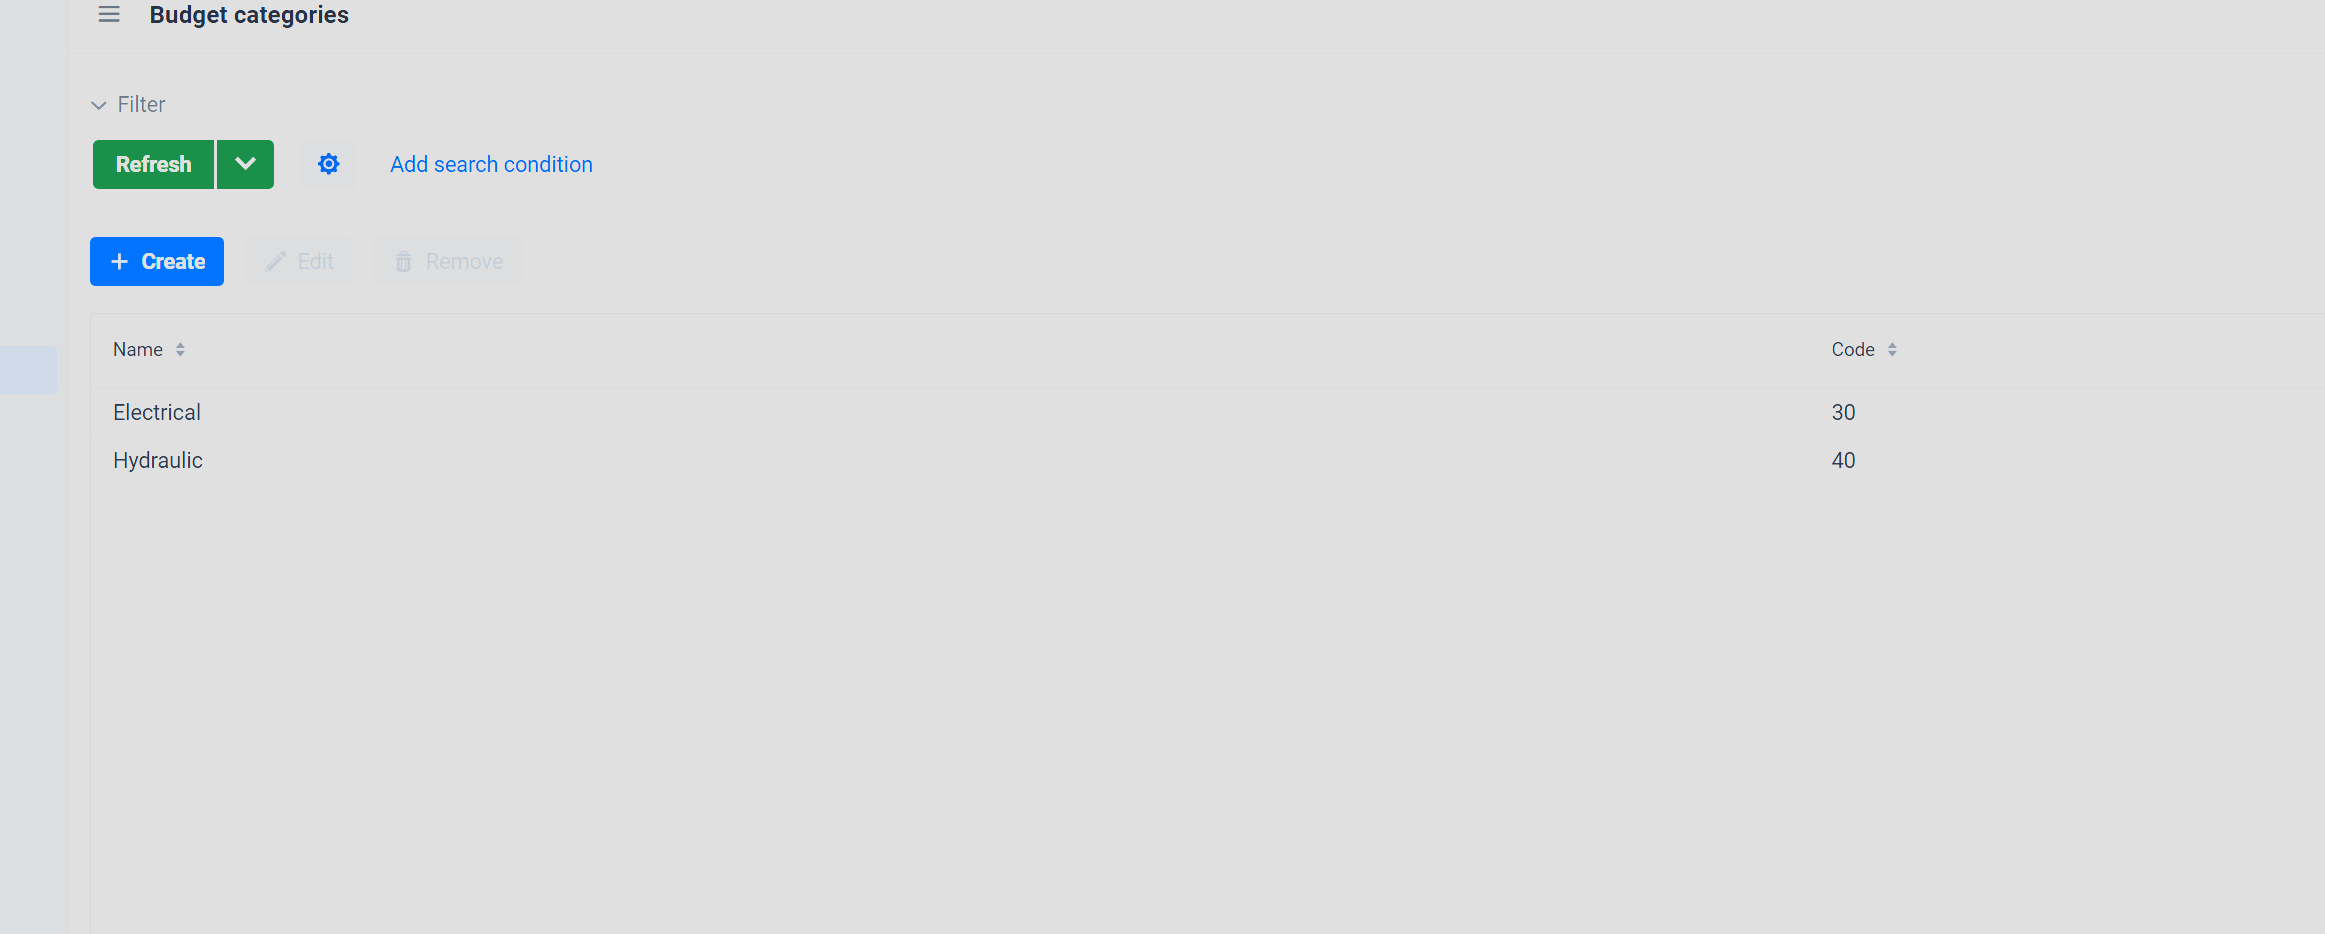
I have one entity that is called BudgetCategory. It maps codes from external sources into a human-readable format. Those categories are user input and so are fully dynamic.
@Getter
@Setter
@JmixEntity
@Table(name = "AGNICIO_BUDGET_CATEGORY")
@Entity(name = "agnicio_BudgetCategory")
public class BudgetCategory extends BaseTenantEntity {

    @InstanceName
    @Column(name = "NAME")
    private String name;

    @Column(name = "CODE")
    private String code;
}

We then collect costs and budgets. There is a multitude of sources and entities. we don’t want to deal with their specific complexities.
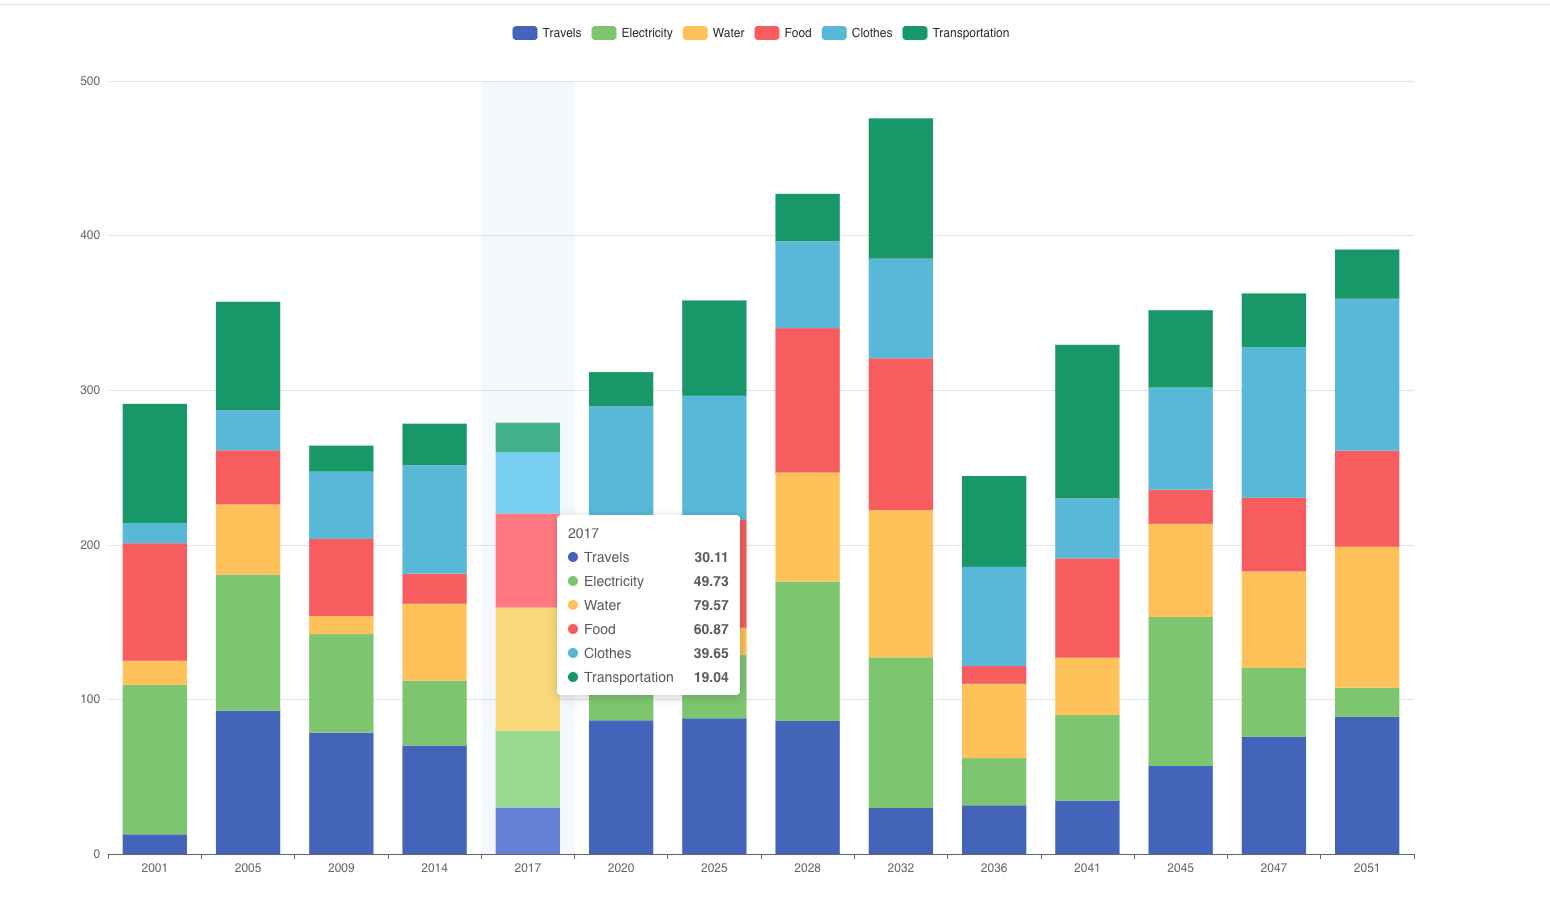
So for displaying it in the graphs we will be either mapping this on simpleDateItem or a simple dto entity.
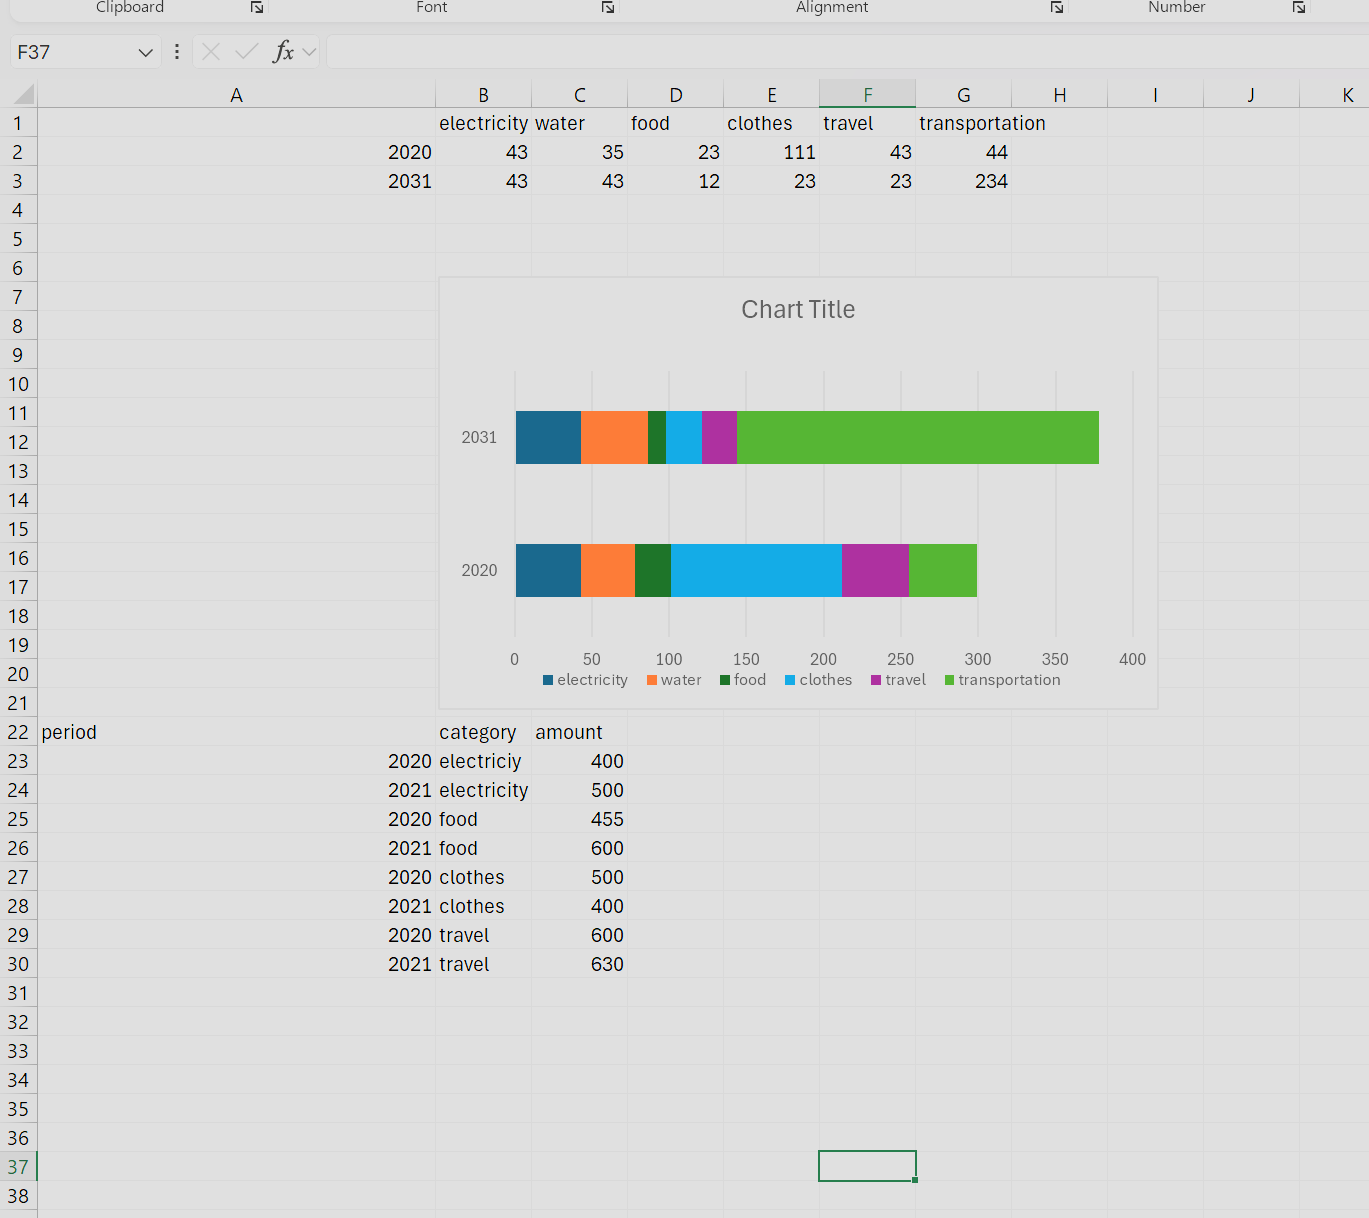
The years, categories and stacks are fully dynamic.
Note that the stack should be vertical instead of horizontal like in the screenshot. But this was the fastest way I got it out of excel.
public record YearlyAmountDto(String year, String category, BigDecimal value) {}

