100 datapoints (vehicles) showed on a street map for Berlin
the vehicle points should be shown using an icon
refreshed every 10-15 min
when clicking on one of the datapoints, additional (up to 100) which are related to the clicked vehicle should be shown, connected via lines (it is a tour the vehicle will drive) and having different colors
The goal is to have a tour management overview for up to 100 vehicles
where each might have 100 tour stops…
using the JMIX app in real life situation via mobile it turns out that this functionality would be extremely helpful when using the map addon:
we have single pdf files for each object where a driver needs to work,
including hand painted routes around a building or along a street
the difficulty we have, is, that actually we have to switch between the pdf and i.e. Google maps.
It would be extremely helpful, if we could use the maps addon to combine both:
showing the routes around a building they need to drive in the online street map and also the actual position of the vehicle… in that way the driver does not need to switch both visualizations…
the actual position lat/lng we know, we just need to be able to combine that with fixed coordinates to draw the routes and in the same moment to see where they are…
Yes, I think it is possible to implement. Features have click listeners and can be differently styled.
Could you clarify how do you get the geo data? Do you load data from database or using external data service through the REST?
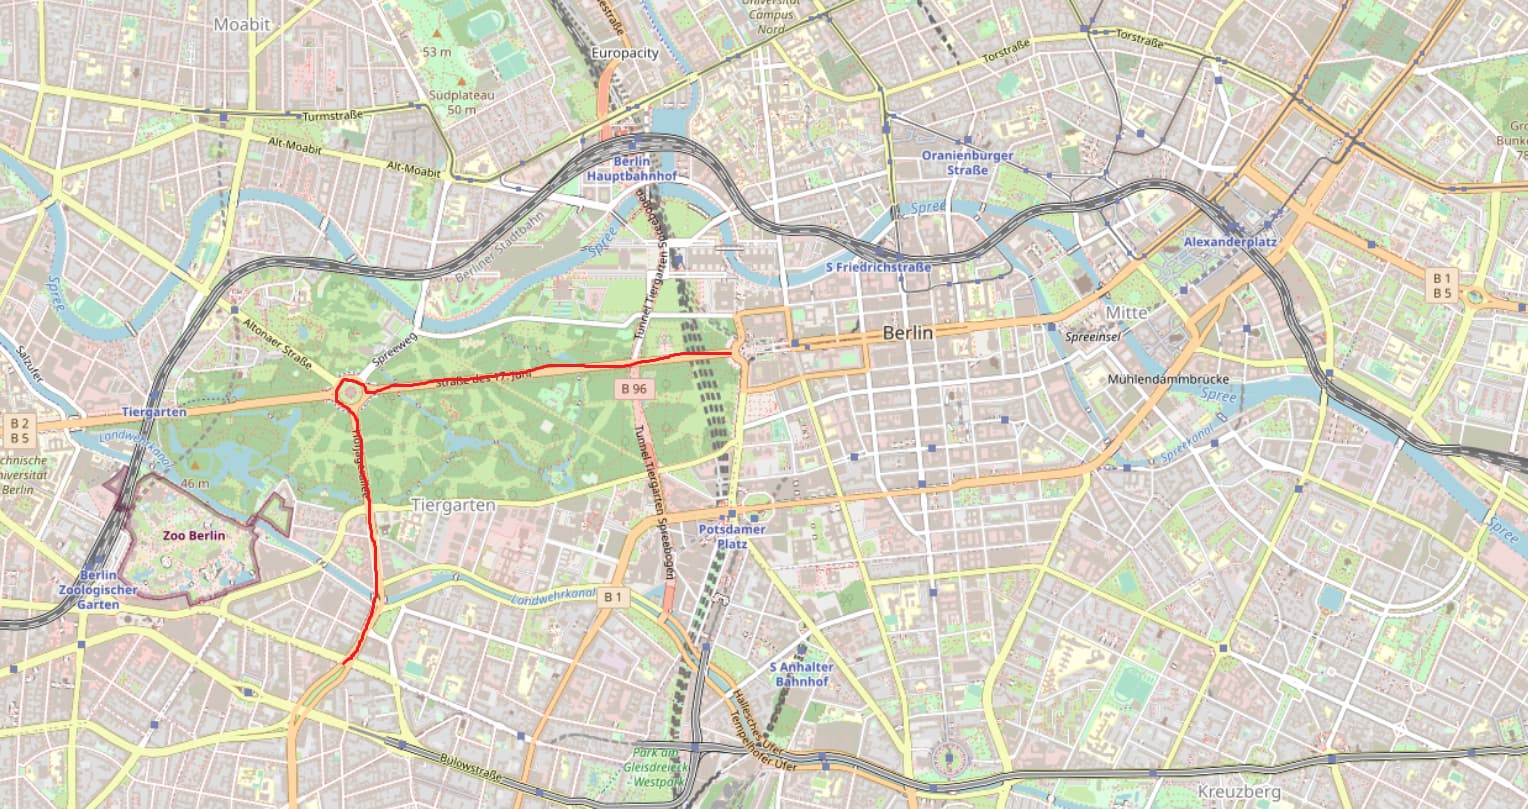
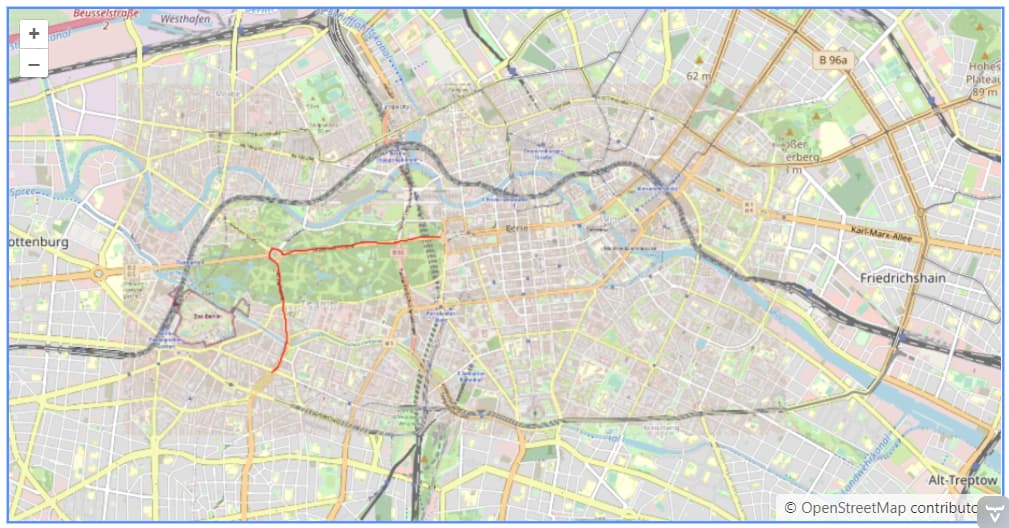
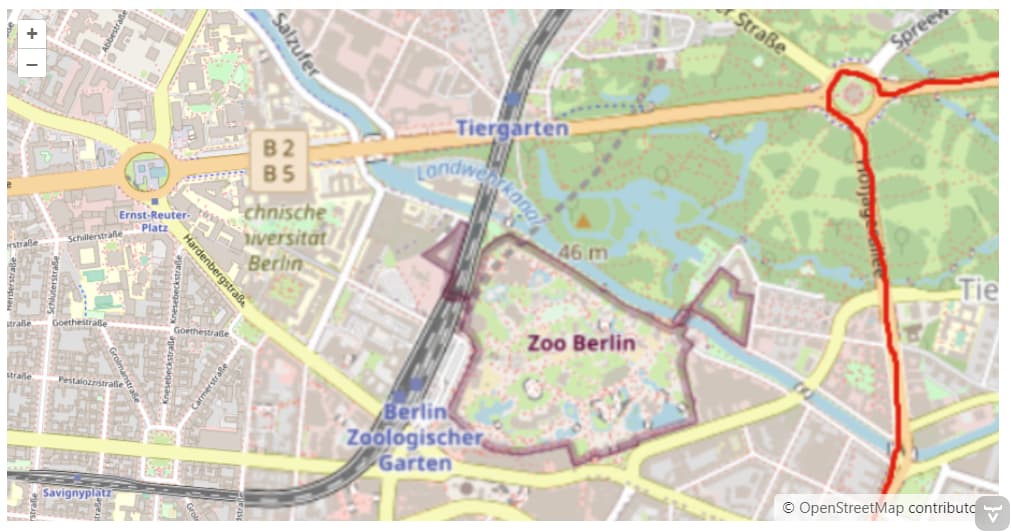
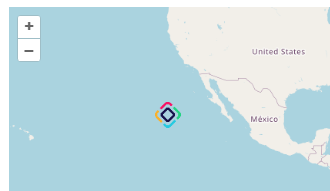
As far as I know OpenLayers does not support showing PDF files. However it is possible to show images that can overlay the actual map tiles. If PDF files contain an image with route you can place this image as an additional image layer. For instance, I took screenshot of the map segment of the Berlin and wrote some route (red line).
Then specified an image layer with extent and projection.
thx… better answer (what is possible) than I expected…
the gps coordinates we get from 2 sources:
fixed coordinates where a route starts (small routes, just 30 m street or around a building…)
live coordinates for each vehicle via Rest api call
regarding the maps/pdf
also a nice idea what you wrote…
but the pdf files would not be needed any longer, if the lines could be drawn inside the map itself…
I tested that with Google Maps, created a new map in my_maps, draw some line around a building and then used that map in the standard Google map app.
In the end it should not play a role which mobile device is used or which navigation app is used…
I would like to keep the fixed coordinates in our DB, even those which are needed to draw the lines and get the live data vie Rest API.
But we need to separate the usage scenarios:
1.
One is this live navigation with prepared layers for showing the lines
2.
And the other one would be a more static dashboard
where the controller can see (refreshed every 10-15 min) where all vehicles are and where they can click on one vehicle and then see all tour nodes (and hide the others)
so,
one mobile app for navigation with an extra layer for lines
one stationary dashboard in the office to get the overview monitoring
took some time to understand and transfer it to our app…
But, it works fine…
What we can achieve with this solution is the dashboard monitoring,
showing all tours and vehicles with additional information about the status (colors)
and notes… in dialogs.
great…
But for the online navigation,
I do not see yet how to bring it on the smartphone with realtime navigation
like Google Maps navigation…
It might work if we read the GPS coordinates maybe every 15 or 30 sec for a single
tourpoint/vehicle combination…
I need to check if that will work on a small display…
one little thing:
I tried to change the marker icon, following the doc how to handle streamResource…
I copied an icon into …/src/main/META-INF.resources.icons
and tried to use that this way:
“icons/icon.png” also tried multiple other writings…
but the icon is never found…
What do I oversea here?
The marker which is in the maps external source works fine…
“/META-INF/frontend/jmix-openlayers-map/icon/marker.png”
thx… I was confused,
because you sent the code I already used, but which did not work.
But then I saw my mistake…
Little awkward
While transfering your the logic from your sample app into my one,
I copied the icon I wanted to use into the directories of the sample app,
but ran my app…
drawing the lines works.
But, I need to draw single lines in one layer, which do not automatically connect.
Is there a way to do that?
I had a look in the OpenLayers docs and it looks like that it might be possible,
but cannot see how to do that in JMIX Maps.
now I got everything together… can get the live coordinates every 5 sec for all vehicles…
the monitoring dashboards shows all cars in the map
click on one shows the tour object with different status color…
click on one of it shows details and the controller can directly write a notification to the driver and maybe put that single object on the reclamation tour, if needed
the driver got navigated to the single object using google maps…
when they arrive and start working, they can see the map with the lines around the building where they need to clean
every 5 sec they see their own vehicle and they can check if they are still on the line
brilliant from my view the Map addon is definitely worth to get the enterprise subscription and then together with the notifications addon: bull’s-eye
using LINESTRING I need to use i.e.: 13.xxxxx 52.xxxxx
But in Google or Bing Maps or where ever I looked,
I get the coordinates the other way round: 52.xxxx 13.xxxx
I try to copy and paste coordinates to create multiple objects/lines and need to convert the values every time.
Sure, I can write a little method for that.
But, what is the reason why LINESTRING needs it the other way round?
Because of two different and incompatible conventions. Latitude and longitude are normally given in that order. Maps are 2D representations/projections of the earth’s surface, with coordinates expressed in the x,y grid of the Cartesian system. As they are by convention drawn with west on the left and north at the top, this means that x represents longitude, and y latitude. As stated above, OpenLayers is designed to handle all projections, but the default view is in projected Cartesian coordinates.
is there a way to add linebreaks to the text (.withText(…))?
the openlayer docs are writing about multiple tuples ‘,’\n’,’…
But what ever I tried, I cannot get a linebreak in the text.