Hello, I’d like to know what are the plans for the Charts addon with FlowUI, is it going to be implemented anytime soon? Also, what is the equivalent for jsComponent in FlowUI so I can at least implement my own charts with JavaScript.
Thank you!
Hello, I’d like to know what are the plans for the Charts addon with FlowUI, is it going to be implemented anytime soon? Also, what is the equivalent for jsComponent in FlowUI so I can at least implement my own charts with JavaScript.
Thank you!
Hi,
We have no specific plans for charts add-on in FlowUI yet.
Regarding the integration of web components, you may read the corresponding section in Vaadin documentation.
Hi @joaquin.ruiz369,
if you like you can use a existing Vaadin add-on, which is simple to integrate in Jmix FUI, so you don’t do the heavy lifting with JS your own.
I used for my project the Vaadin add-on ApexChartsjs which uses the free ApexCharts JS library underneath.
(There are other Vaadin add-ons available e.g. SO_Charts which uses Apache EChart as chart library)
I don’t created an own custom component in Jmix, so it’s not available as a own tag in the XML descriptor and you have to create the object in the controller.
First you need to add the dependency for the Vaadin component to your build.gradle:
implementation 'com.github.appreciated:apexcharts:23.0.1'
Next, in the XML descriptor I added a hbox element with a ID which later contain the chart object.
At least, create the chart object in the controller’s BeforeShowEvent. You have to do your own data mapping since this is not a Jmix element, of course ;-).
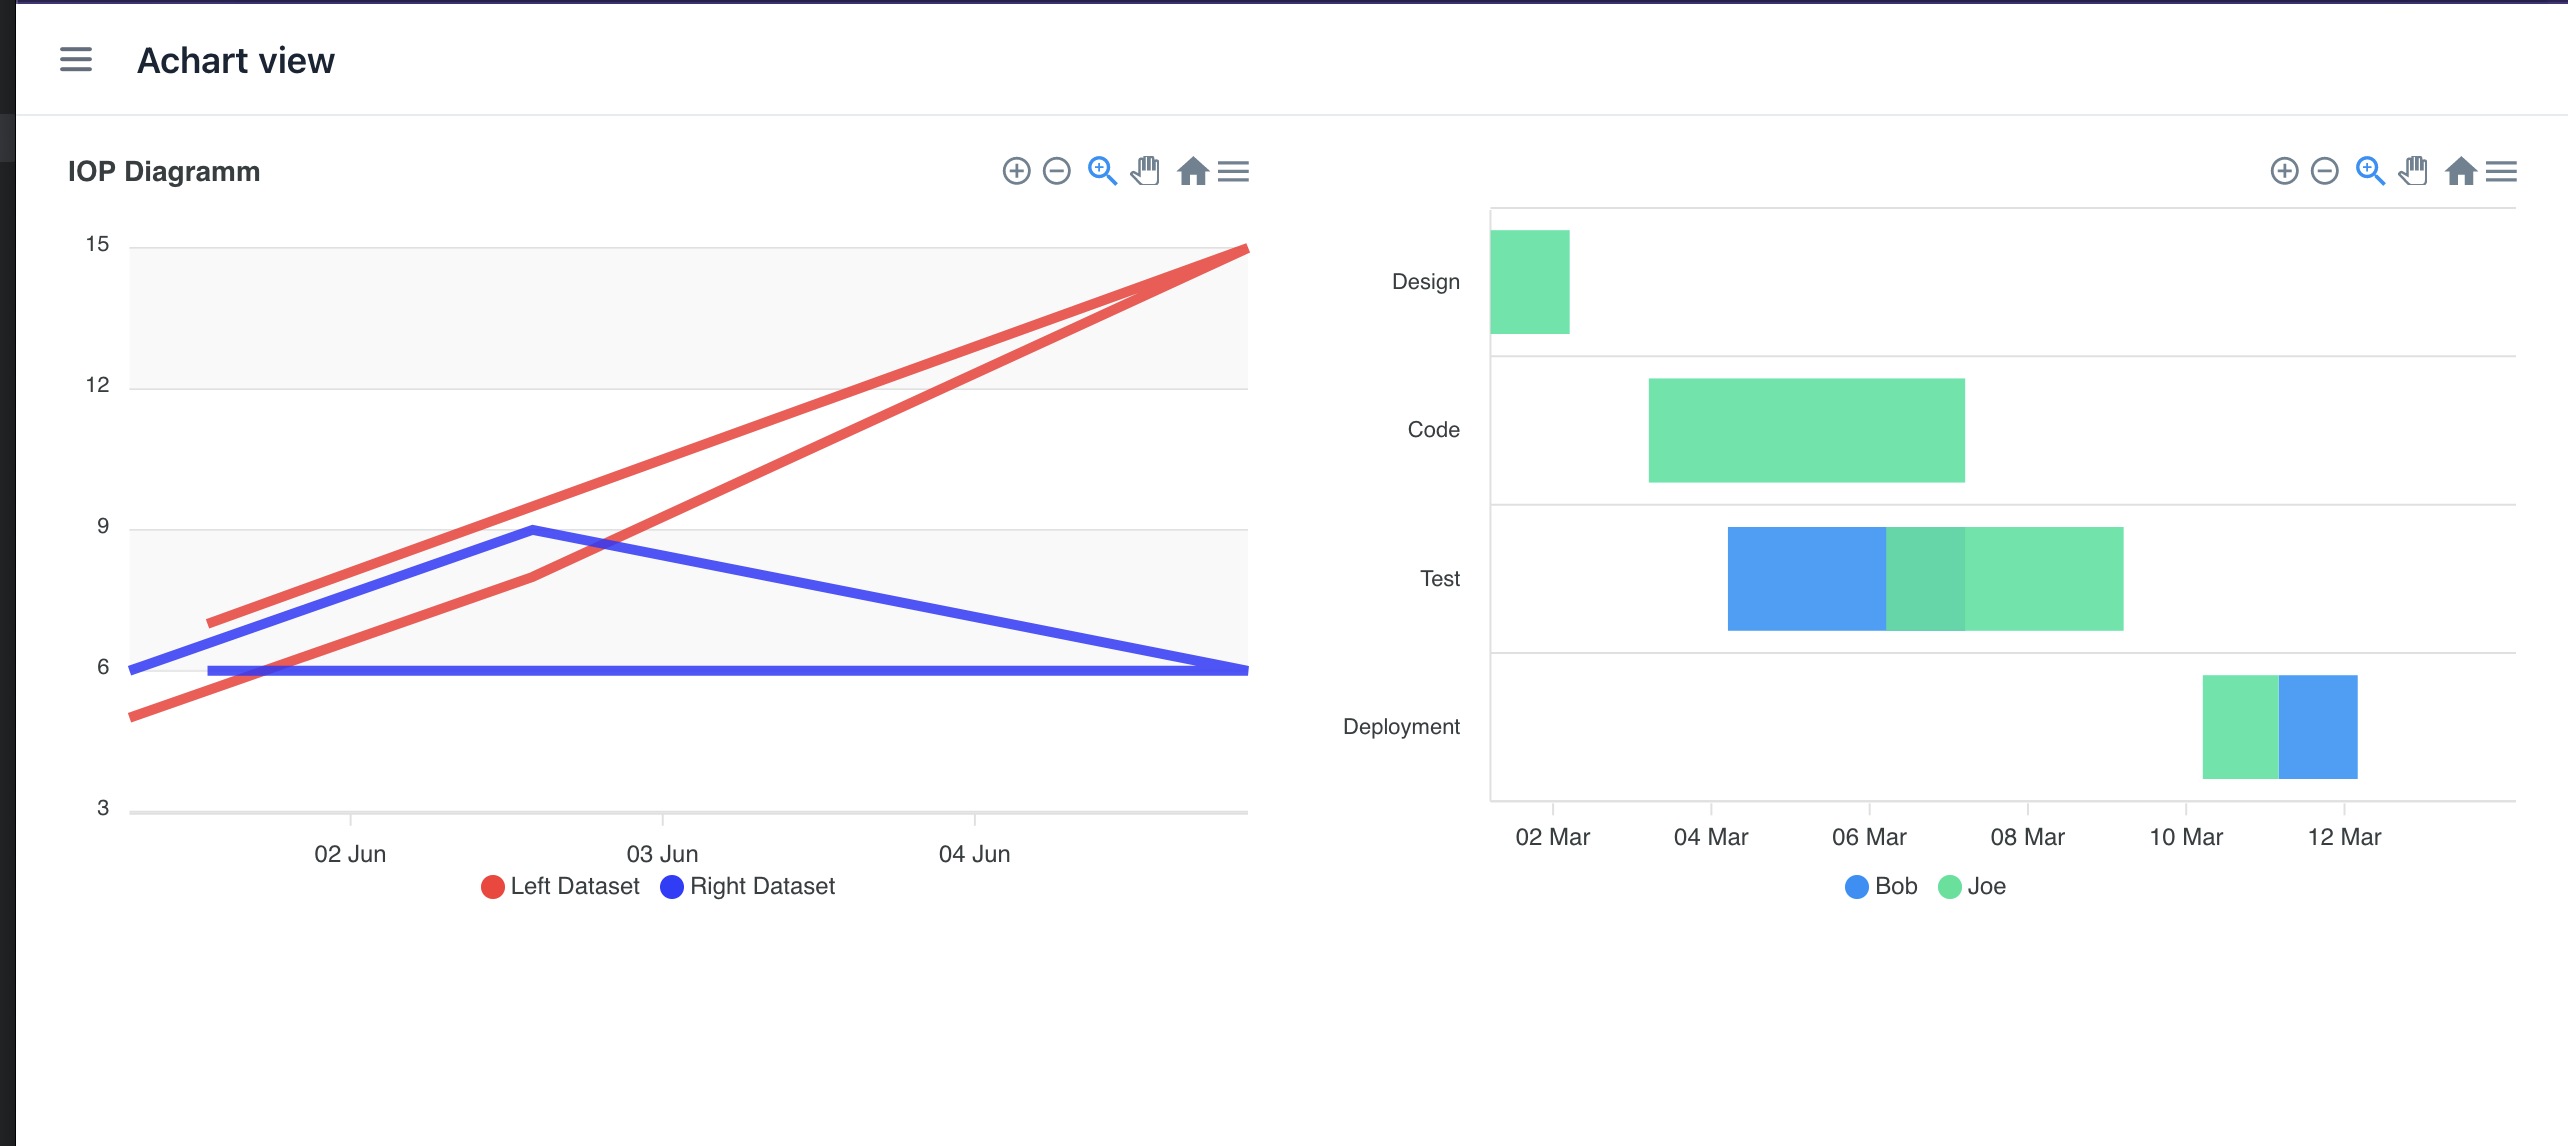
(The example shows a line char with 2 date/time based charts)
@ViewComponent
private HorizontalLayout hbox;

@Subscribe
public void onBeforeShow(BeforeShowEvent event) {
    List<MeasurementValue> allItems = measurementValuesDc.getItems();

    List<Coordinate> leftData = new ArrayList<>();
    List<Coordinate> rightData = new ArrayList<>();

    for (MeasurementValue mv : allItems) {
        Long lv = mv.getLeftValue();
        Long rv = mv.getRightValue();
        String ts = getISOString(mv.getMeasureDate().getTime());

        if (rv != null && rv > 0L) {
            rightData.add(new Coordinate<>(ts, rv));
        }
        if (lv != null && lv > 0L) {
            leftData.add(new Coordinate<>(ts, lv));
        }
    }

    ApexCharts lineChart = ApexChartsBuilder.get()
            .withChart(ChartBuilder.get()
                    .withType(Type.LINE)
                    .withZoom(ZoomBuilder.get()
                            .withType(ZoomType.X)
                            .withEnabled(true)
                            .build())
                    .build())
            .withStroke(StrokeBuilder.get()
                    .withCurve(Curve.STRAIGHT)
                    .build())
            .withTitle(TitleSubtitleBuilder.get()
                    .withText("IOP Diagramm")
                    .withAlign(Align.LEFT)
                    .build())
            .withGrid(GridBuilder.get()
                    .withRow(RowBuilder.get()
                            .withColors("#f3f3f3", "transparent")
                            .withOpacity(0.5).build()
                    ).build())
            .withXaxis(XAxisBuilder.get()
                    .withType(XAxisType.DATETIME)
                    .build())
            .withSeries(new Series<>("Left Dataset", leftData.toArray()),
                    new Series<>("Right Dataset", rightData.toArray()))

            .withColors("#ff3333", "#3333ff")
            .build();

    hbox.add(lineChart);
}
I hope that will give you a first clue…
BR
Stefan
I gave a try, looks nice.
FormLayout makes it responsive view too 
Thank you so much for all your responses, very well explained!